Campground Revenue & Financial Projections Calculator
Campground Revenue Business Projection Calculator
Basic Information
Loan Information
Campground Details
Site Information
Monthly Costs
Operating Expenses
How to Use the Calculator
Here's how to use this calculator. For the default settings, I looked for industry data from trusted sources to make the benchmarks more realistic.
Loan Information
- Initial Purchase Price ($): Enter the total cost of the campground (Default: $1,000,000). The KOA website says the average cost to buy a campground will range from $100,000 – $2,000,000. (Data Source: https://ownakoa.com/2023/04/06/how-much-does-it-cost-to-start-a-campground/)
- Down Payment (%): Specify the percentage you'll pay upfront (Default: 10%). This is a common industry standard for commercial loans, but you may need to put down 20% – 25% if you don't have experience managing a campground business or depending on your specific loan type.
- Loan Interest Rate (%): Enter the annual interest rate on your loan (Default: 6%). These rates will vary on a variety of factors including your credit score and current rates.
- Loan Term (Years): Define the loan repayment period (Default: 20 years).
- Annual Appreciation Projections (%): Estimate the annual increase in property value (Default: 3%).

Campground Details
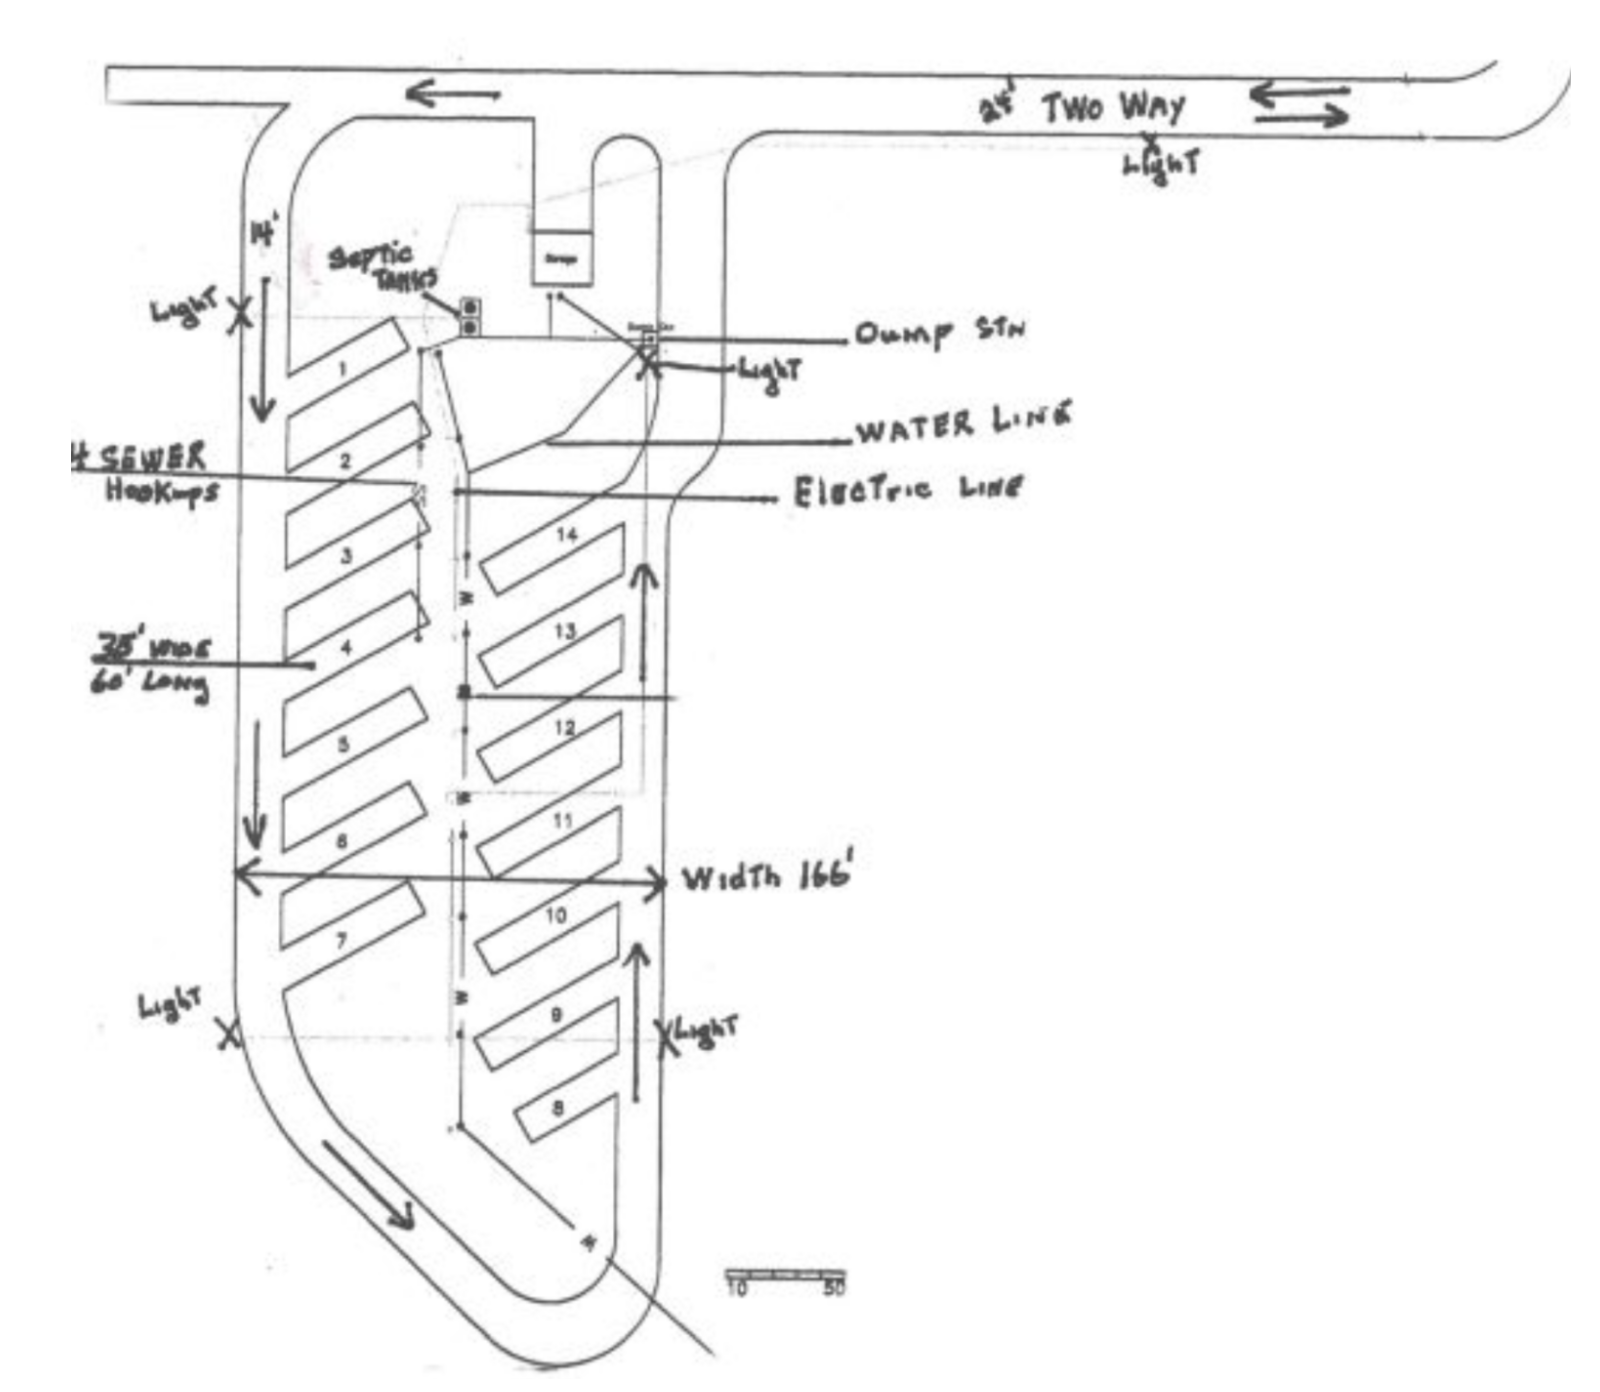
- Number of Campground Sites: Total number of rentable sites (Default: 80). KOA recommends 75 to 90 sites for profitability so I went with a default number in the middle of that range. (Data Source: https://ownakoa.com/2023/04/06/how-much-does-it-cost-to-start-a-campground/)
- Monthly Rent Per Site ($): Average monthly fees collected per site each month. (Default: $350).
- Additional Services Revenue Per Site ($/month): Revenue from premium amenities like cable tv, Wi-Fi, laundry services, snacks, vending machines or firewood delivery could all be additional services. I set the default to $100 per month based on this interview with the owner of an RV park conducted by Codie Sanchez.
- Occupancy Rate (%): Expected percentage of sites rented (Default: 70%). The average RV park occupancy rate of 60% to 70% providing a realistic benchmark for revenue potential. (Data Source: https://www.roverpass.com/blog/rv-park-industry-statistics/)
- Campground Open Months Per Year: Number of months the campground operates (Default: 9).

Monthly Costs
- Monthly Property Management Fee ($): Costs for onsite staff or management (Default: $10,000). You could also enter your estimated expense of paying all onsite staff in this section.
- Monthly Maintenance Costs ($): Average maintenance expenses (Default: $1,000).
- Other Monthly Operating Costs ($): Miscellaneous operating expenses (Default: $1,000).
Once all inputs are set, click the "Calculate" button to see results.
Important: This tool should not be considered financial or investment advice. Please seek out the guidance of professionally trained and licensed individuals before making any investing decisions.
Understanding the Formulas
Here's how to understand the formulas behind all the calculations and outputs in this tool.
Total Initial Investment:
Initial Investment = Purchase Price × (Down Payment / 100)
Monthly Loan Payment:
M = P × [r(1+r)^n / ((1+r)^n - 1)]
Where:
- M = Monthly payment
- P = Principal (Purchase Price – Down Payment)
- r = Monthly interest rate (Annual rate ÷ 12)
- n = Total number of months (Years × 12)
Example Calculation:
$800,000 loan, 5% annual interest, 30 years
- P = $800,000
- r = 0.05/12 = 0.00417
- n = 30 × 12 = 360 = $4,294.57 monthly payment
Revenue Calculations
Monthly Gross Revenue:
Monthly Revenue = (Site Rent + Additional Services) × Sites × (Occupancy Rate / 100)
Annual Gross Revenue:
Annual Revenue = Monthly Revenue × Operating Months
Monthly Total Expenses:
Monthly Expenses = Management Fee + Maintenance + Operating Costs
Total Annual Expenses:
Annual Expenses = Monthly Expenses × Operating Months
Net Operating Income (NOI):
This is a simple way to measure how much money a property earns after covering its regular operating expenses, but before paying for things like loans or taxes.
NOI = Annual Revenue - Annual Expenses
Cash-on-Cash Return (CoC Return):
This is a way to measure how much money you're making from your initial cash investment in a property. It shows the percentage of your cash investment that you're earning back each year as profit.
Cash Return = [(NOI - Annual Loan Payments) / Initial Investment] × 100
Projected Property Value:
This is an estimate of how much your campground or RV park will be worth in the future, based on how much its value is expected to grow each year. Keep in mind that while real estate typically does appreciate in value, there are time periods were value could remain flat or even depreciate.
Future Value = Purchase Price × (1 + Appreciation Rate / 100)
Break-even Occupancy Rate:
This is the minimum percentage of your sites that need to be rented out for you to cover all your expenses, including loan payments.
Monthly Revenue at X% Occupancy = Monthly Expenses + Monthly Loan Payment
What You Need to Know About Campground Revenue
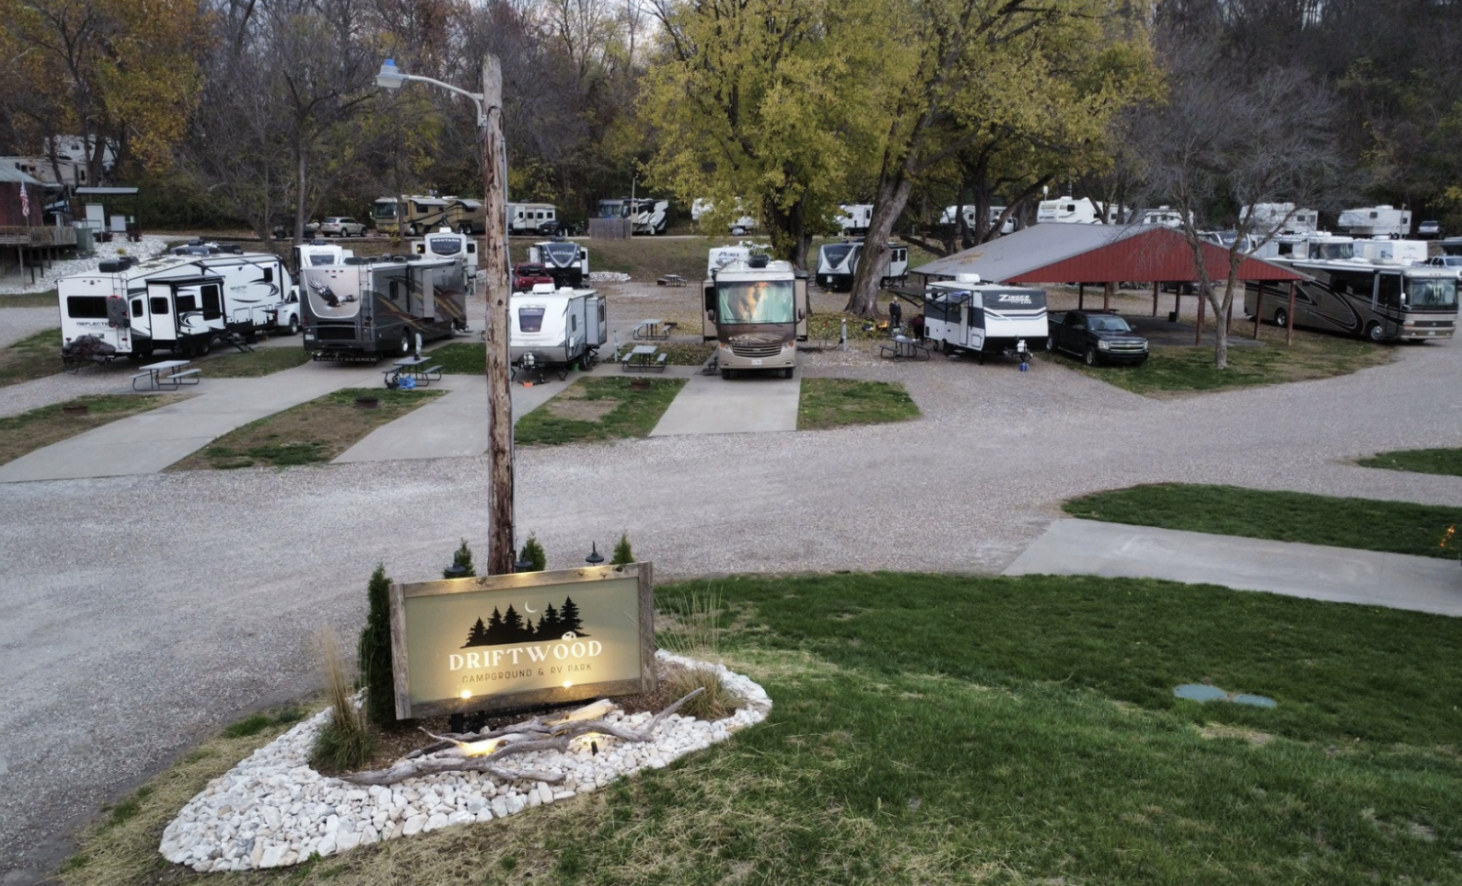
Kyle Grimm, owner of Driftwood Campground and RV Park, a 50-site campground in Quincy, IL, provides real-world insights into maximizing campground profitability. Here are three key lessons that I built into the Campground Revenue Calculator based on Kyle's direct experience. This information can help a lot with the accuracy of your inputs for this tool so don't overlook it.
1. Understand the Expense Ratio
Kyle emphasizes the importance of knowing your expense ratio to manage costs effectively: "If we make $100,000 a year gross… you can plan on a campground like ours to operate at somewhere between a 50 and 60 percent expense ratio."
This means that for every dollar earned, $0.50 to $0.60 is spent on operating costs like utilities, lawn care, taxes, and insurance. This insight directly ties to the "Monthly Total Expenses" and "Annual Total Expenses" fields in the calculator, helping you accurately project costs.
Example: If you project $200,000 in annual gross revenue, the calculator can factor in a 50-60% expense ratio to show you the remaining income available for debt payments and profit.
2. Account for Seasonal Revenue Fluctuations
Campgrounds often experience seasonal highs and lows. Kyle shares: "Our campground is seasonal… in the winter, it's obviously way slower. But during peak season, we can generate on the low end $15,000 a month and on the high end $30,000 or a little more."
The "Campground Open Months Per Year" field in the calculator allows users to account for these seasonal variations. For example, entering "9 months" instead of a full year will adjust the revenue projections to reflect a realistic operating schedule if you're in the upper Midwest.
Example: If you rent sites for $40 per night during peak months and $20 per night during slower months, the calculator can estimate your Monthly Gross Revenue and Annual Gross Revenue based on these variable rates.

3. Leverage Diverse Revenue Streams
Kyle highlights the value of adding amenities and services to boost income: "The beautiful thing about a campground is there is so much opportunity for add-ons… golf cart rentals, a little camp store, or even a restaurant."
This directly relates to the "Additional Services Revenue Per Site" field in the calculator. By entering potential revenue from extras like Wi-Fi, golf cart rentals, or firewood sales, users can project how these income streams impact their overall profitability.
- Example: If each site generates $100 per month from additional services, the calculator shows how this boosts your Annual Gross Revenue and ultimately improves metrics like Cash-on-Cash Return.
