Input your starting and final value to calculate growth rate. Click the “Advanced option” to choose your timeframe, and instantly see your growth trajectory with a visual timeline that are perfect for presentations, planning, and performance tracking.
Growth Rate and Percentage Increase Calculator
Basic calculation using only start and end values.
Time Frame
Growth Type
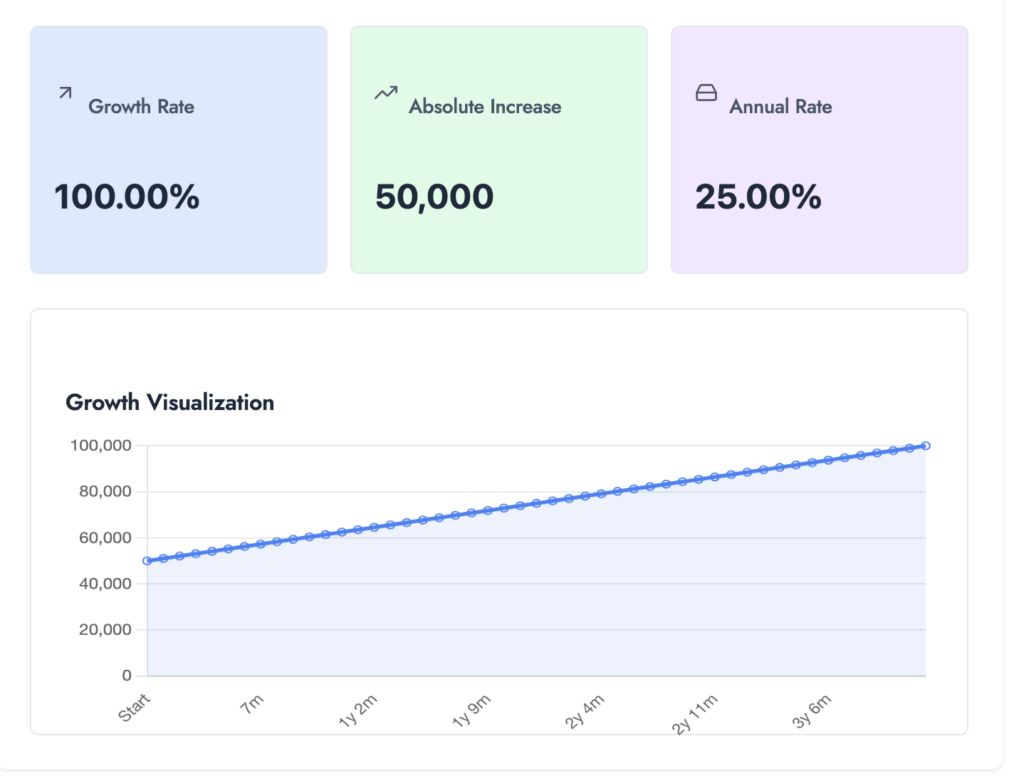
Linear Growth: Shows a constant rate of increase over time, like a straight line. The value increases by the same amount in each period.
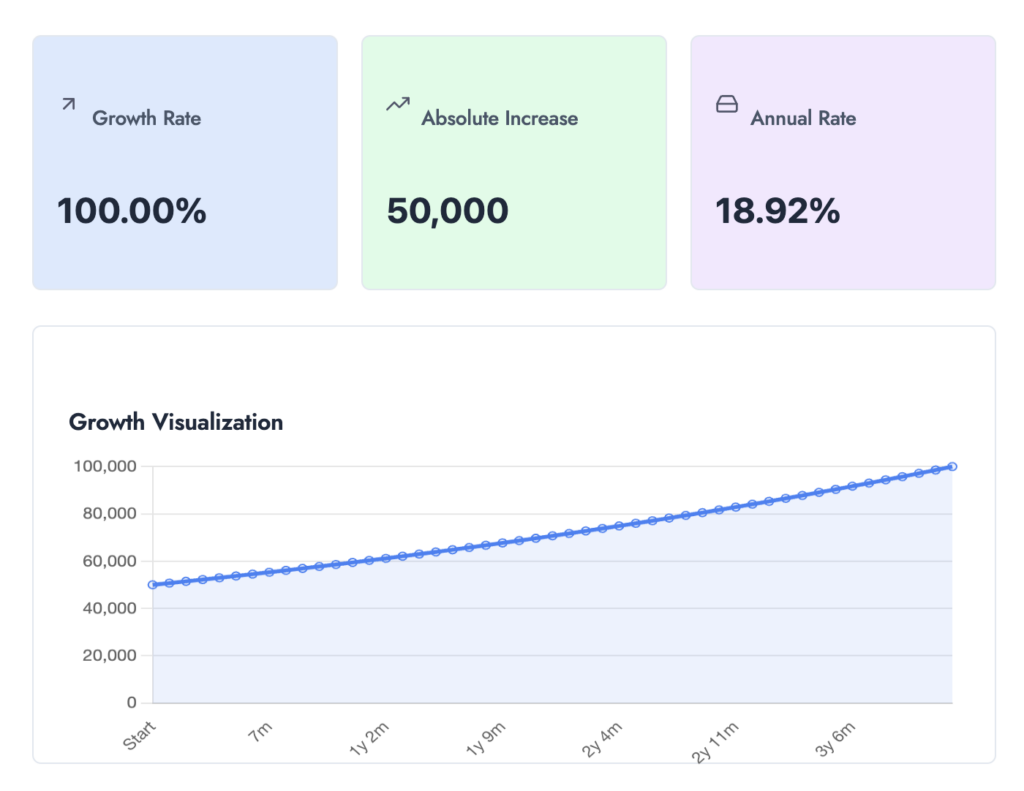
Compound Growth: Shows exponential growth where the rate is applied to the growing value each period, resulting in a curved line that increases more steeply over time.
Growth Rate
0%
Absolute Increase
0
Annual Rate
-
Growth Visualization
How to use the calculator
Basic Calculations
- Enter your Starting Value – This is your initial or baseline number.
- Enter your Final Value – This is what the number grew (or decreased) to.
- Click “Calculate” to see the basic growth or decline metrics.
Advanced Options
For more detailed analysis, click the “Advanced Options” tab to see:
- Time Frame – Specify the duration in years and months
- Growth Type – Choose between:
- Linear Growth (steady, consistent increase)
- Compound Growth (accelerating increase over time)

Linear growth rate example from the calculator.
Understanding the results
The calculator provides three key metrics:
1. Growth Rate (%)
- Shows the total percentage change from start to finish
- Formula:
Growth Rate = ((Final Value - Initial Value) / Initial Value) × 100 - Example: If a value grows from 100 to 150, the growth rate is ((150 – 100) / 100) × 100 = 50%
2. Absolute Increase
- The actual numerical increase in value
- Formula:
Absolute Increase = Final Value - Initial Value - Example: Growing from 100 to 150 gives an absolute increase of 150 – 100 = 50
3. Annual Rate (When time period is provided)
- Shows the yearly rate of growth
- For Linear Growth:
Annual Rate = Total Growth Rate / Number of Years - For Compound Growth:
Annual Rate = (Final Value / Initial Value)^(1/years) - 1) × 100
Linear vs. Compound Growth
Linear Growth
- Increases by the same amount each period.
- Best for: Steady increases like salary raises or fixed monthly savings.
- Example: A $1,000 annual raise means +$1,000 every year.
Compound Growth
- Growth rate applies to an increasing base. This gives you that nice hockey stick growth projection that you can use for presentations. This tool assumes starting number will increase by 10% each year.
- Best for: Investment returns, population growth, or compound interest.
- Example: A 10% annual investment return means the actual dollar increase gets larger each year.

Compound growth rate chart.
Practical ways to use this tool
Business owners use percentage change calculations in a variety of ways:
Evaluating Revenue Growth Each Year:
If revenue grew from $10,000 to $22,000 in a year, that’s a 120% increase, which could be used to attract investors or put into perspective how much progress your side hustle had this year.Marketing Campaign ROI:
A business spending $10,000 on advertising that generates $22,000 in sales can calculate their return as 120% growth in revenue.Financial Forecasting:
Companies use percentage change to project future earnings and set realistic goals.
Related tools:
Opportunity Cost Calculator for Financial Decisions: Compare growth rate projections for different investments like stock, bonds, or savings accounts.