Find the right self-storage market faster with our intuitive screener tool. Evaluate key indicators like household income, rent trends, and development activity in seconds. Perfect for investors who want a quick, data-backed overview before diving deeper into analysis. You can even download the results of this tool vis csv file to save for later.
Self-Storage Investment Market Screener
Evaluate market strength and demand for self-storage investment opportunities
Market Analysis Results
Score Breakdown:
How to Use this Market Screener
By analyzing six critical market factors, this feasibility screener provides a data-driven approach to self-storage investing. Here’s how the scoring methodology is determine and where you can find accurate input data to get the best results from this tool based on research.
Understanding the Scoring System
The screener uses a 30-point scoring system, evaluating six key market metrics worth up to 5 points each:
Step 1: Market Saturation (5-mile radius)
- Less than 10 SF per capita: 5 points
- 10-15 SF per capita: 3 points
- More than 15 SF per capita: 1 point
Why it matters: Market saturation directly impacts occupancy rates and pricing power. Lower saturation indicates less competition and higher potential demand.
Where to find this input:
- Radius+: A great industry tool specifically designed for self-storage data. Use Radius+ to find market saturation statistics within specific mile radii.
- Google Maps: Search for storage facilities in a 3 – 5 mile radius.

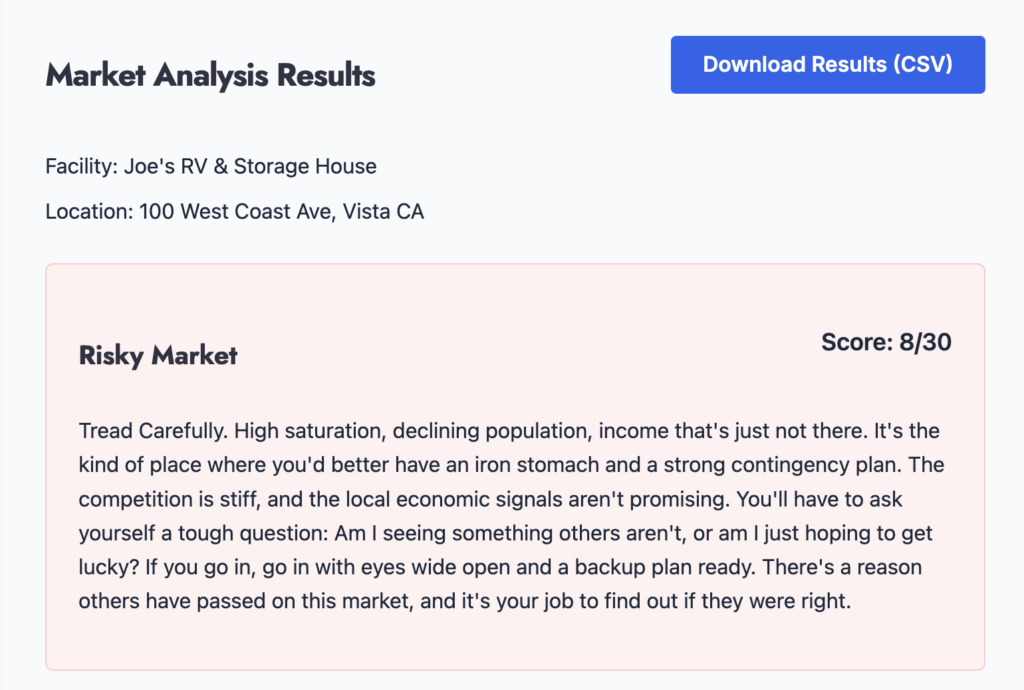
Sample market screener results for a risky market.
Step 2: Renters Percentage (3-mile radius)
- Above 40%: 5 points
- 30-40%: 3 points
- Below 30%: 1 point
Why it matters: Renters are primary users of self-storage, typically having less storage space at home and more transient storage needs.
Where to Find It:
- U.S. Census Bureau: Use the American Community Survey (ACS) data to look up the percentage of rental households in your target area.
- Zillow or Realtor.com: They often have insights on the rental market and can give a snapshot of rental demographics in specific neighborhoods.
Step 3: Population Growth (5-mile radius)
- Above 3% growth: 5 points
- 0-3% growth: 3 points
- Negative growth: 1 point
Why it matters: Growing populations indicate increasing demand for storage services and potential for market expansion.
Where to Find It:
- U.S. Census Bureau: The Population Estimates Program (PEP) provides annual estimates of population growth.
- City Data Websites like City-Data.com: Offers free access to population trends and growth data.
Step 4: Household Income (5-mile radius)
- Above $80,000: 5 points
- $50,000-$80,000: 3 points
- Below $50,000: 1 point
Why it matters: Higher income areas typically generate better rental rates and have more discretionary spending for storage.
Where to Find It:
- U.S. Census Bureau: The American Community Survey provides median household income data by zip code or county.

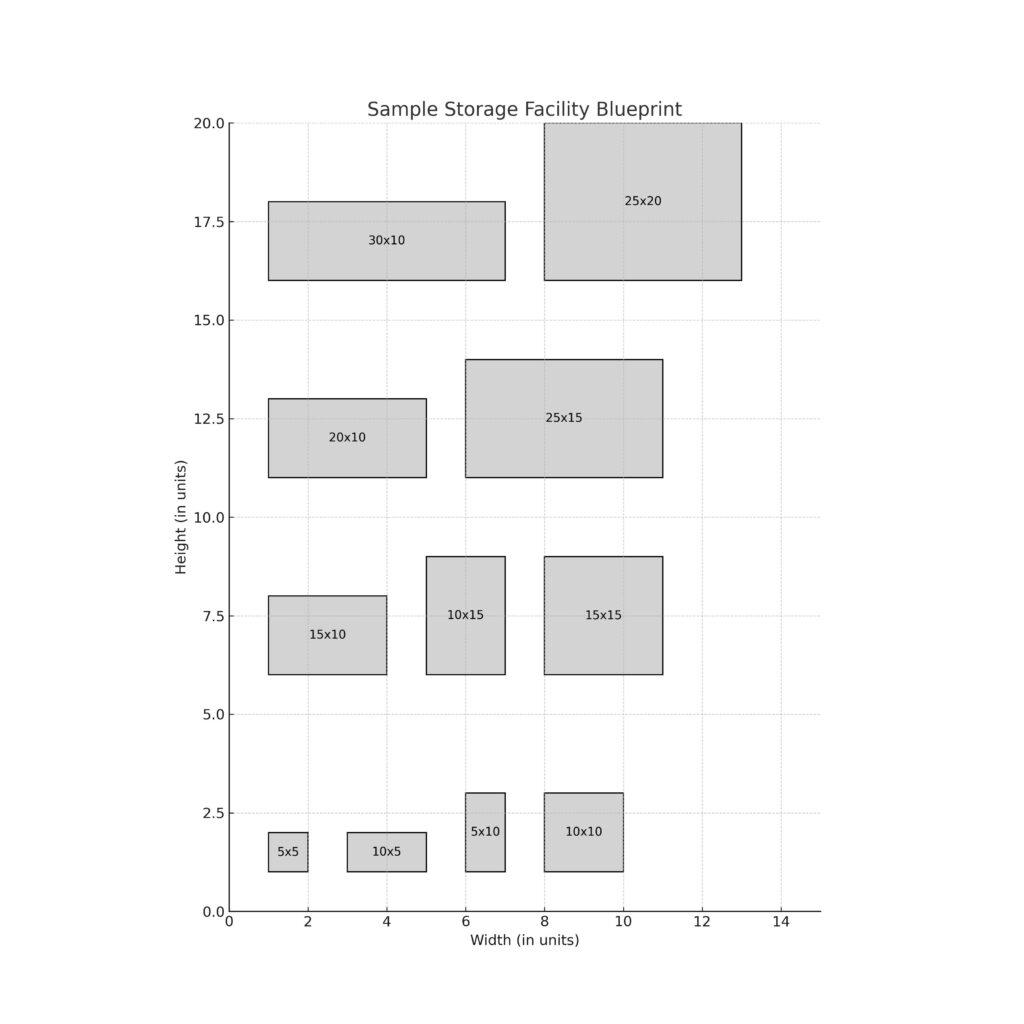
Sample blue-print for a storage units / sizes.
Step 5: Development Pipeline
- Less than 5% of current rentable SF: 5 points
- 5-10% of current rentable SF: 3 points
- More than 10% of current rentable SF: 1 point
Why it matters: The development pipeline indicates future competition. Lower percentages suggest less competitive pressure on rates and occupancy.
Where to Find It:
- Radius+: Provides insights on planned and under-construction facilities in the area. You could also go old-school and drive a neighborhood to get a sense of the level of new development.
Step 6: Rent Trend (5-mile radius)
- Above 5% increase: 5 points
- 0-5% increase: 3 points
- Negative trend: 1 point
Why it matters: Positive rent trends indicate market strength and potential for revenue growth.
Where to Find It:
- Yardi Matrix: Provides extensive rental data and trend analysis for self-storage markets.
- Online Research: You can often find monthly rental rates and specials for local storage businesses online by searching their website. You can also give local storage facilities a call for quotes.
Your Next Steps in Due Diligence Process
The Self-Storage Market Screener provides a structured approach to evaluating market potential, but it’s important to remember that it’s one tool in a comprehensive investment analysis process. Use it to identify promising markets and red flags, but it’s only a small part of an overall due diligence process. This self-storage deal evaluation calculator is a good place to continue your research.
I worked directly with self-storage investor and police officer Kevin Bell to determine the inputs and evaluation process of this tool, but his research approach goes much deeper than what we can cover in this tool. If you want to learn more about Kevin Bell’s current projects or contact information, you can find it here.

Meet Kevin Bell.
Is it well-maintained, clean, and secure? A facility with good upkeep is a strong sign that the current owner takes care of it, reducing future repair costs. Pay attention to the unit mix (variety of sizes) and current occupancy rates, as high occupancy usually signals strong demand. Consider whether there’s potential for expansion, like adding more units, RV parking, or climate-controlled storage. This can significantly boost revenue without additional land costs.
Finding attractive self-storage markets
Most self-storage markets can be successful if you find the right deal terms, such as a good purchase price, favorable financing, and a location with strong demand. For example, Kevin Bell acquired his first storage unit in Kansas… a location you won’t find on any of the top investing markets.
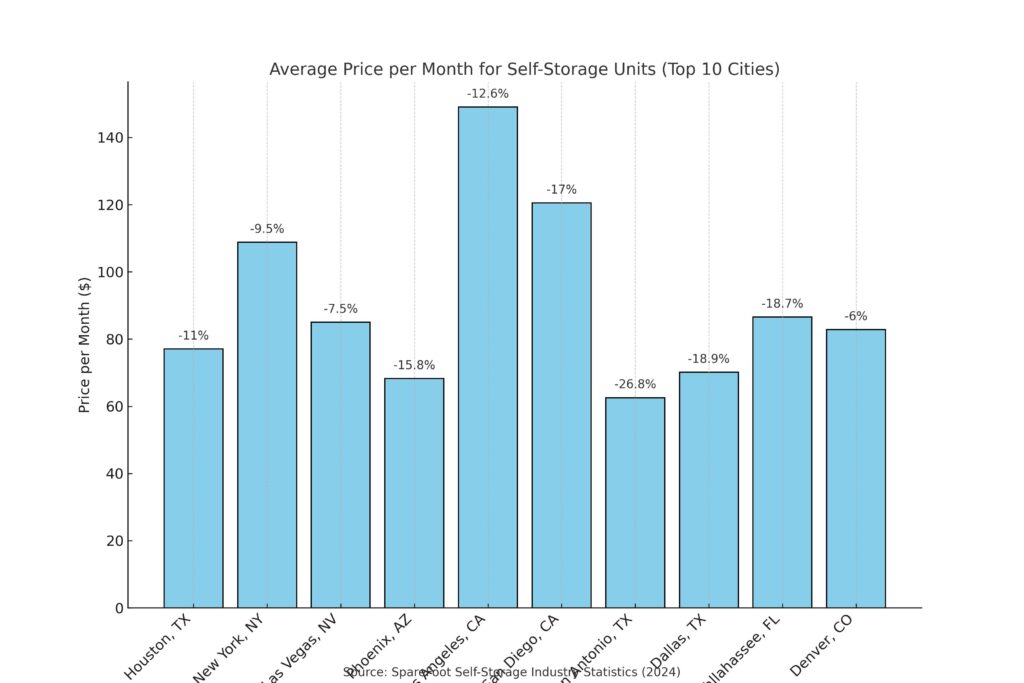
When you’re scouting for a good market to invest in self-storage, understanding rental trends is crucial. This chart gives a quick snapshot of average monthly prices and how they’ve changed over the past year in the top self-storage markets in the United States based on data provided by Al Harris at SpareFoot.

City comparison of the self storage market.
How This Data Helps Find a Good Market:
High vs. Low Rent Markets: Cities like Los Angeles and San Diego have high monthly rents, which can be a sign of strong demand or limited supply. Both are good indicators for potential investment. However, high rents also come with high competition. In contrast, cities like San Antonio and Phoenix have lower rents, which might seem less attractive initially, but they could present an opportunity for growth, especially if the market is underdeveloped or has room for expansion.
Price Trends and Market Health: The year-over-year percentage change shows how rental prices are moving. Significant declines in cities like San Antonio (-26.8%) and Dallas (-18.9%) might be a red flag, indicating oversupply or weakening demand. On the other hand, smaller decreases, like in New York City (-9.5%) and Denver (-6%), suggest more stable markets that could be safer bets for investment.
Fitting It Into the Bigger Picture: This data should be one part of your market analysis toolkit. High rents and stable trends are good signs, but don’t stop there. Look at population growth, income levels, and any new self-storage developments in the area. Even a city with high rents might not be a good investment if there’s a flood of new facilities opening soon.
Overall, this chart helps narrow down which markets might be worth a deeper look, showing you where the demand is strong and where caution might be needed due to falling prices or potential oversaturation.
Related tools:
Self-Storage Facility Investing Deal Calculator: Continue your due diligence and go beyond market analysis to dive into the details of cash flow, cap rate, and unit-level profitability of a facility.